Red - high intensity.
Intensity corrected for power drop off;
Black - low intensity;
White - high intensity.
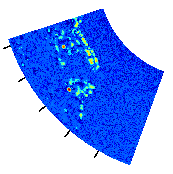
| File 3: 19931106_003838_surv.cdf | |
|---|---|
|
| Dark blue - low intensity; Red - high intensity. |
|
| Limited to open ocean view (70-215°); Intensity corrected for power drop off; Black - low intensity; White - high intensity. |